The reports are based on the data from TL Booking Engine and the property management system that you use in your property, for example, TL WebPMS.
To generate a report, select the month and the rate plan you need. And click on the “Display” button.

Revenue metrics
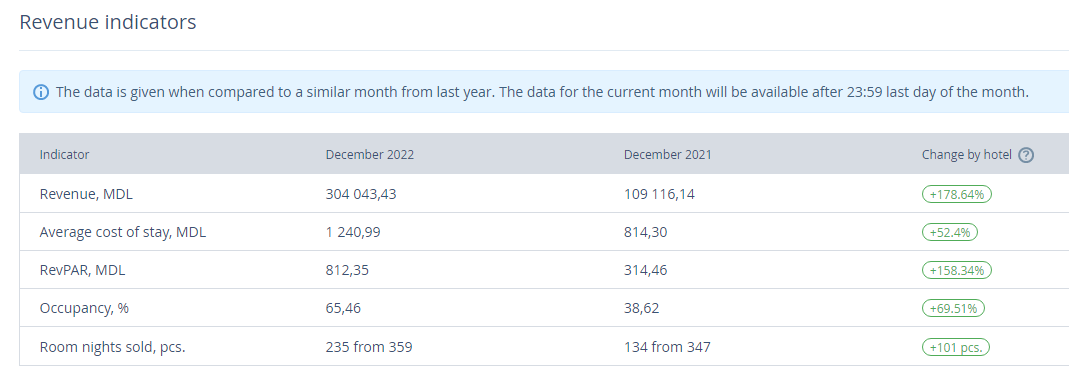
In the report, this year’s performance for the selected month is compared to the corresponding month last year.
Revenue — the amount made off the hotel room sales within the selected month
Average daily rate — average room fee that is calculated by dividing the total revenue by the number of room nights sold
RevPAR — average revenue per room that is calculated by dividing the total revenue by the number of room nights available
Occupancy — the hotel’s occupancy rate that is calculated by dividing the number of room nights sold by the total number of room nights available
Room nights sold — the total number of nights in all the bookings within the selected period
Statistics on the dynamic pricing
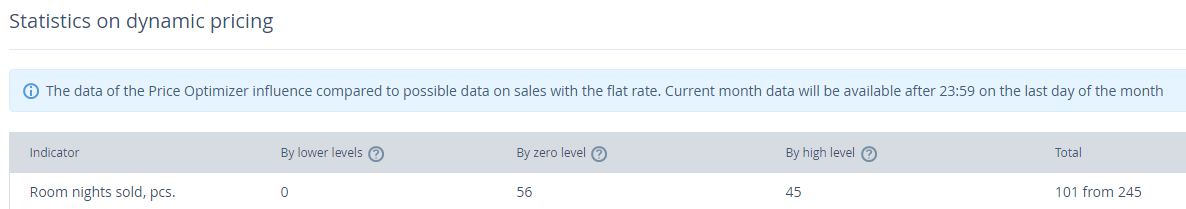
In the report, you can compare the numbers of room nights sold at different price levels. All the bookings made at the dynamic rate plans and the rate plans derived from them get to the report.
At zero level — the number of room nights sold at a base rate plan without changing a price level
At lowered levels — the number of room nights sold at a price level that is lower than the base one
At raised levels — the number of room nights sold at a price level that is higher than the base one
The “Total” column has a ratio of the room nights sold at dynamic rate plans and the room nights sold at all the rate plans created in your TravelLine account.
The first number stands for bookings at dynamic rate plans.
The second number stands for bookings at all the rate plans.