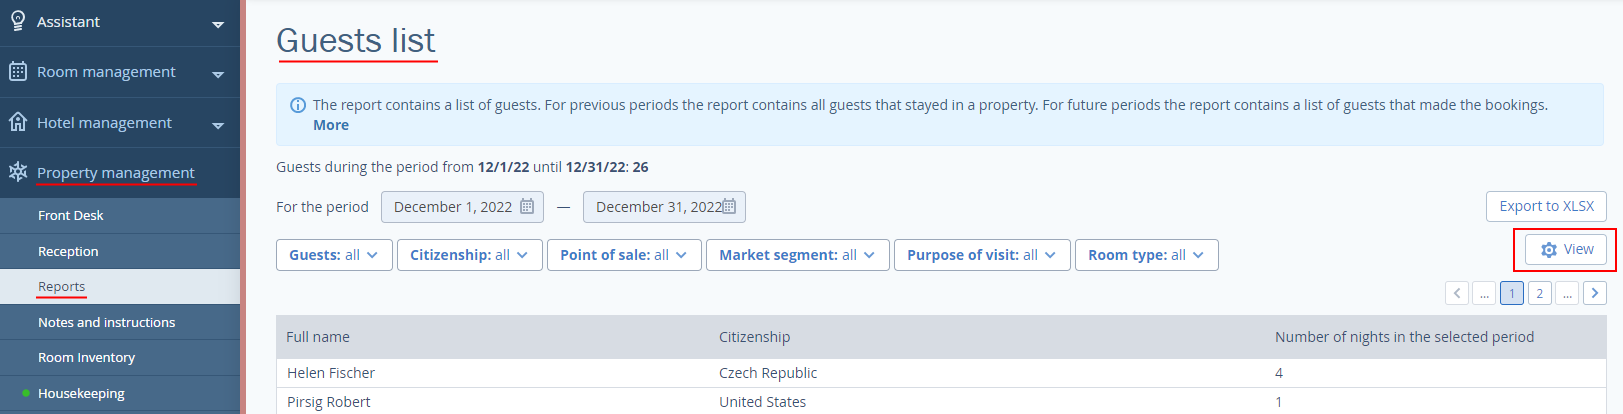
1. In the “Reports” section, go to the “Guest list” report. Then, select a reporting period and click on the “View” button.
2. In the window open, tick the following boxes:
Full name
Citizenship
Number of nights in the selected period
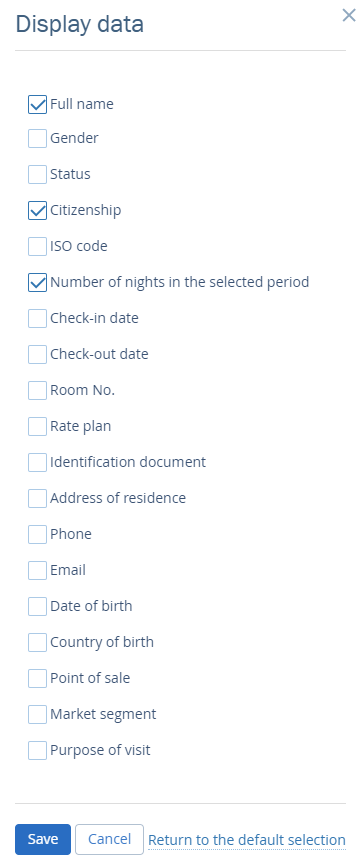
Then, click on the “Save” button.
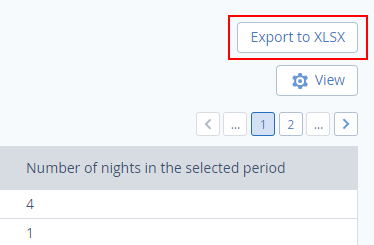
3. Download the report you just made by clicking on the “Export to XLSX” button.
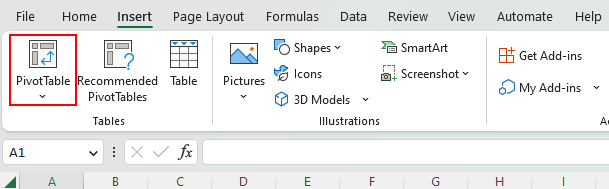
4. Open the Excel file you just saved and select the entire table. Click on the “Pivot table” button in the “Insert” menu. Learn how to “Create a PivotTable to analyze worksheet data”.
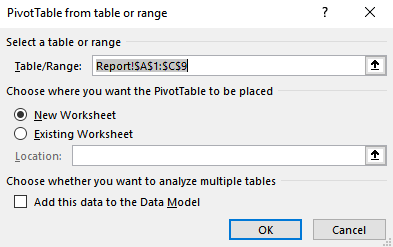
5. Check the settings. Then, click on the “OK” button.
6. In the “PivotTable fields” window open, select fields to add to the report:
Full name, Citizenship, Number of nights in the selected period
Move the “Full name” field from the “Rows” to “Values”
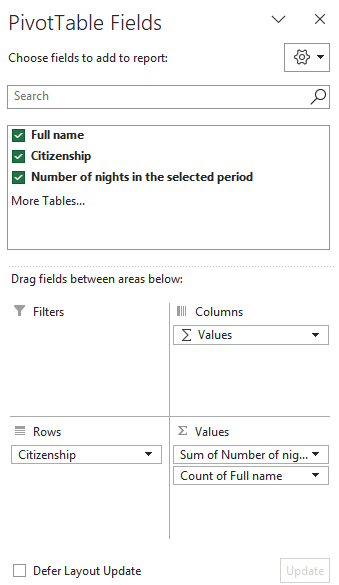
Learn how to “Use the field list to arrange fields in a PivotTable”.
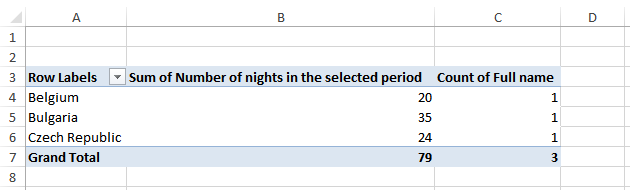
7. The table is ready.