This is a new type of manager report with fixed comparison periods. It was developed in accordance with the international USALI (Uniform System of Accounts for Lodging Industry) standards, a universal accounting system for analyzing and managing a property.
The report shows statistical information on key metrics of the property's operational activities:
FTD — for the selected day.
MTD — from the beginning of the month to the selected day.
YTD — from the beginning of the year to the selected day.
The report also helps to assess the growth rate of these metrics compared to the data of the previous year.
The data in the report is updated once a day at 05:00 local property time.
How to generate a report
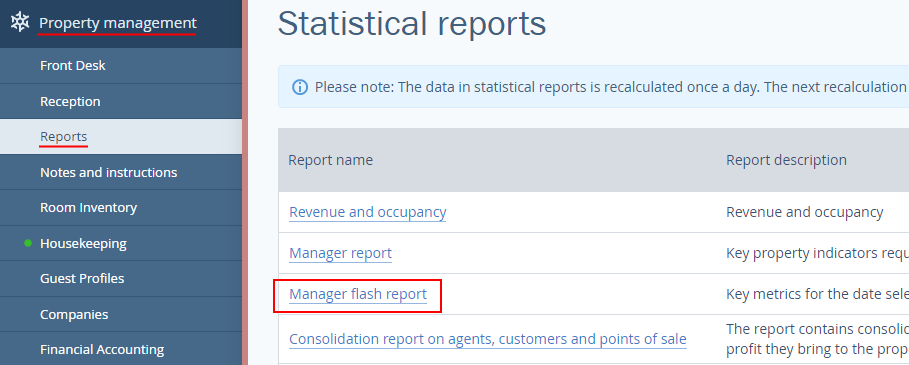
1. Open the "Reports" page in the "Property Management" section and select "Manager flash report" in statistical reports.

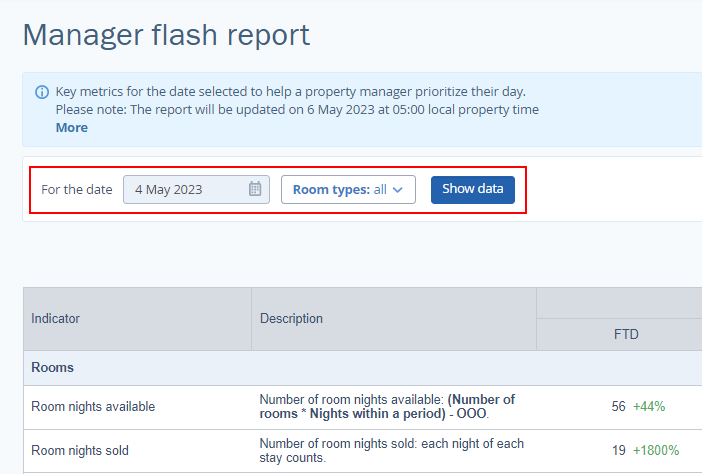
2. Select a date. By default, the report is generated for the current date. Use the filter to select the date you are interested in.

For example, if 4 May 2023 is selected, clicking on the "Show data" button will display six columns of data.
Current year:
FTD — data for 4 May 2023.
MTD — data for the period from 1 May 2023 to 4 May 2023.
YTD — data for the period from 1 January 2023 to 4 May 2023.
Previous year:
FTD — data for 4 May 2022.
MTD — data for the period from 1 May 2022 to 4 May 2022.
YTD — data for the period from 1 January 2022 to 4 May 2022.
3. Select one or more room types. By default, all room types are selected, and when you click on the "Show data" button, the report shows aggregate data for all room types, including deleted ones.

If you select one room type, the report will only include data for this room type.

If you select several room types, the report will include data for these room types. The filter will then display the number of selected room types out of the total.

How to compare this year's data with the last
In the report, the current year's data is compared with the previous year's data — day to day, month to month, year to year. Based on this comparison, the dynamics of indicators (growth rate) is calculated in percentage terms. The percentage value is output without a fractional part, rounded to the nearest whole number.
The formula for calculation is: Growth rate = (V new - V old) / V old x 100%.
V new - the value of the indicator in the current year.
V old - the value of the indicator in the previous year.
If the indicator value has increased compared to the previous year, the dynamics are positive.

If the indicator value has decreased compared to the previous year, the dynamics are negative.

If the indicator value has not changed compared to the previous year, it’s zero dynamics.

If the indicator value was zero in the previous year, it cannot be compared.

Indicators in the report
Rooms
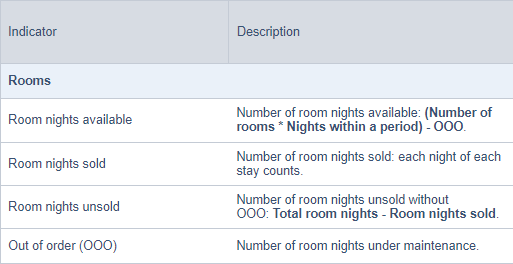
Room nights available — total number of room nights available. Rooms ignored in statistics and rooms under maintenance are not taken into account. Calculated by formula: (Number of rooms х Nights within a period) - Out of order.
Room nights sold — number of room nights sold: each night of each stay counts. Rooms ignored in statistics are not taken into account.
Room nights unsold — number of room nights unsold. Rooms ignored in statistics and rooms under maintenance are not taken into account. Calculated by formula: Total room nights - Room nights sold.
Out of order (OOO) — number of room nights under maintenance. Each room night of each room out of order counts.
Guests
Guests — number of guests: each night of stay for each guest counts.
Adults — number of adults: each night of stay for each adult guest counts.
Occupancy
Occupancy % (with OOO) — occupancy in % with OOO. Rooms ignored in the statistics are not taken into account. Calculated by formula: Room nights sold / (Total room nights + OOO).
Occupancy % (without OOO) — occupancy in % without OOO. Rooms ignored in the statistics are not taken into account. Calculated by formula: Room nights sold / Total room nights.
Check-in/Check-out
Rooms checked-in — number of rooms checked-in.
Rooms checked-out — number of rooms checked-out.
Guests checked-in — number of guests checked-in.
Guests checked-out — number of guests checked-out.
Rooms booked at front desk — number of rooms booked at Front desk and checked-in.
Cancellations for the period — cancellations by rooms (stay period falls on the reporting period).
Cancellations within a period — cancellations by rooms (cancellation date falls on the reporting period).
No-shows — number of bookings marked with the "No-show" status when cancelled from the Front desk.
Revenue
Total Revenue — total property revenue. The daily calculation system is used. For example, for booking dates 1-10 August and reporting dates 1-5 August, revenue on 5-10 May is not included in the report.
Room Revenue — property revenue for accommodation. Revenue on extra services does not count. Revenue on the early check-in/late check-out is included. The daily calculation system is used. For example, for booking dates 1-10 August and reporting dates 1-5 August, revenue on 5-10 May is not included in the report.
ADR — average daily rate. Calculated using the formula: Room Revenue / Room nights sold.
RevPAR — Revenue per available room. Calculated using the formula: Room Revenue / Room nights available.
On the group "Service" — property revenue on the service "Service name".
See a brief description of the indicators and formulas for their calculation in the "Description" column.

How to save data in Excel file
To export the report data to Excel, click on the "Export to Excel" button.

You will receive an Excel file with the date of the report generation in the title. All room types that you previously selected will be included in the report.

